Decoding Obfuscated Stack Traces
One potential drawback of obfuscation is that debugging and troubleshooting obfuscated applications can be difficult due to name mangling. Dotfuscator addresses this drawback by providing an integrated tool that allows you to use your output mapping files to recover the original symbols from obfuscated stack traces. This can be opened in the Dotfuscator Config Editor by going to the Tools menu and selecting Decode Obfuscated Stack Trace...
For example, if you have an obfuscated application that you have shipped and you receive a stack trace from one of your customers, that stack trace might look like this:
Stack Trace:
Unhandled Exception: System.ApplicationException: A bad thing happened!
   at a.a()
   at b.a(String A_0)
   at b.a(String[] A_0)
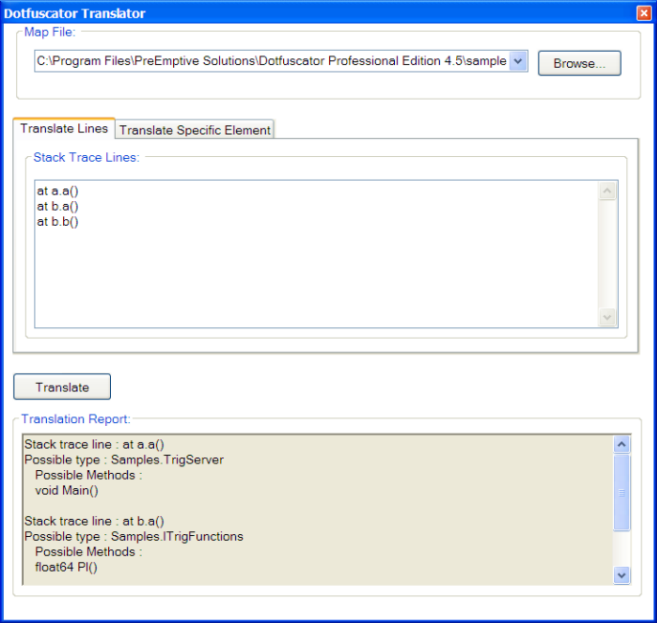
You could use your XML mapping file, or better yet, the HTML Report based on the mapping file to manually recover the original names, but this can be a tedious and time consuming process. The stack trace translation tool automates this by letting you provide a map file, paste the stack trace into a window, and press the Translate button. The translated stack trace is shown at the bottom window:

Some methods in the obfuscated stack trace might be ambiguous; that is, due to the use of Overload Induction and Enhanced Overload Induction, there might be more than one matching un-obfuscated method. In these cases, the tool displays all the possibilities.
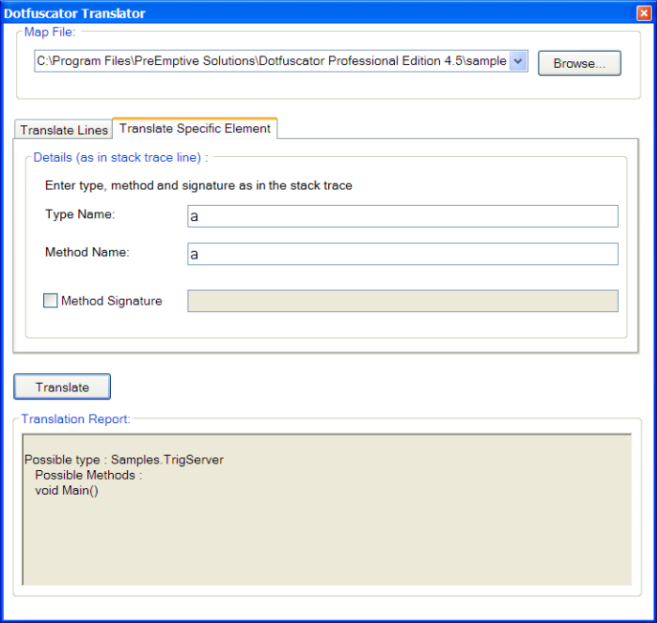
If you just want to look up a specific type or method by name, click the Translate Specific Element tab. You will see a screen that will allow you to type in the obfuscated names of the specific items you want to translate.

- To look up just a type, fill in the Type Name text box and click Translate.
- To look up a method, fill in the Type Name and Method Name text boxes. You can optionally provide a signature by checking the Method Signature check box and filling in the signature in the adjacent text box. The signature must be as it would appear in a stack trace.