
Beginning with Dotfuscator Professional Edition version 4.25, you’ve been able to add anti-debug protections to your .NET applications, and now that Visual Studio 2017 has shipped, Dotfuscator Community Edition (CE) users have access to those protections as well.
If you are reading this, you likely already know that a debugger is a powerful tool for watching and interacting with an application as it runs, and like any powerful tool, it can be used for good or ill. For example, an application owner would likely consider any of the following debugging scenarios “ill use”, when carried out by an unauthorized party:
Static protections, like obfuscation, can help mitigate the threat—it is significantly more difficult to debug a well-obfuscated application—but, as always in security, a layered approach is best. Runtime detections and defenses (like anti-debug), in conjunction with static protections, make for an even more effective deterrent.
In Dotfuscator, these runtime detections and defenses are generally known as “Checks”. Anti-debug is one kind of Check. Dotfuscator includes other Checks as well, such as anti-tamper and expiration (a.k.a. “Shelf-Life”). In each case, Dotfuscator injects the detection code into your application where you tell it to (using a custom or extended attribute). At runtime, when the condition is detected, the application can then defend itself, based on how the Check was configured.
The response options include:
2. Application Notifications. These allow you to modify the state and behavior of your application in any way you wish, in response to a detection. A Check can:
3. Send telemetry to a PreEmptive Analytics endpoint. This allows you to see when — and maybe even who — has triggered the check.
To see some specifics and get an idea of what’s possible, let’s dive in to a concrete example.
For demonstration purposes, we’ve created a simple WPF application: a front end to a remote expense approval service. You can find the source and documentation on Github.
This is a simplified version of the application that PreEmptive’s Sebastian Holst showed in this video. Among other things, the video shows what a debugging attack might look like, and how a debugger can be used to exploit programming flaws in order to escalate privileges. You will get more out of this article if you go watch it right now and come back.
The sample comes with configuration files for both Dotfuscator Pro and CE. We will begin with the Pro configuration, then talk about CE and the differences between the two. If you want to follow along, you should pull the source, build the Release configuration using Visual Studio 2015 or 2017, then open the Dotfuscator configuration file in the Dotfuscator UI, using the configuration that corresponds with your Dotfuscator SKU. If you don’t yet have Dotfuscator, you can find instructions for getting it on the Dotfuscator Downloads page. If you are using CE, you will need the latest version that comes with Visual Studio 2017.
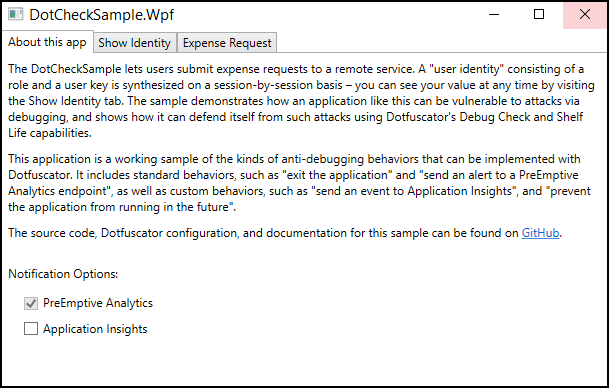
Once open in Dotfuscator, build the project. The build will protect the input EXE and write it to the Dotfuscator output directory. To make the protected application runnable from that directory, you will need to copy the original dependencies manually if you are using CE (The Pro configuration has a post-build event that does this for you). To do so, copy the DLLs from the project’s binRelease directory into the Dotfuscator output directory. When run, the application should look like this:
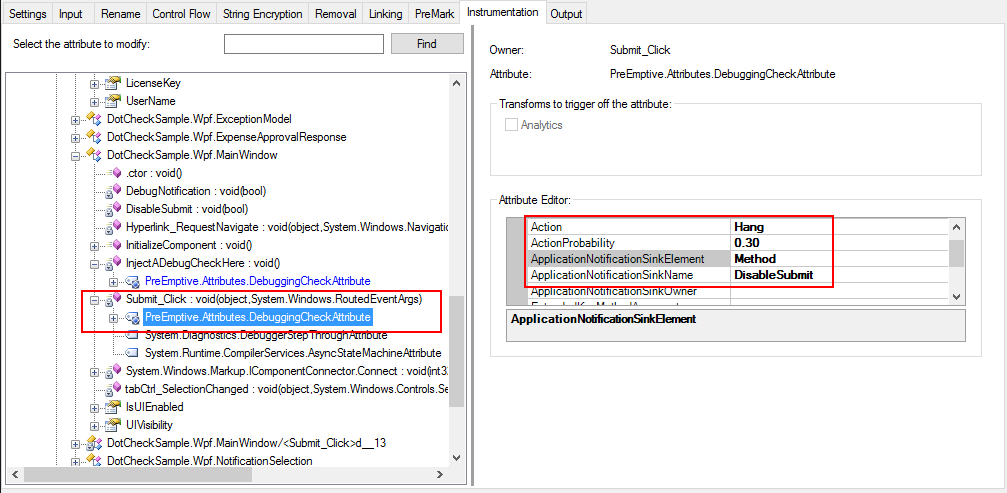
After opening the Pro configuration file with the Dotfuscator Professional standalone UI, you can find the extended attributes used to configure the Checks on the Instrumentation tab.
We will go through each one and describe what it does, how it is implemented, and why it is useful.
Starting at the beginning, the App.Application_Startup() method has a DebuggingCheckAttribute that forces the application to exit 100% of the time if a debugger is attached. This is accomplished by setting the “Action” to “Exit” and leaving the other settings at their default values. Exiting at startup discourages launching the app via a debugger; an attacker must instead attach to the process after starting it.
Also at startup—this time in the App.Main() method—a Shelf-Life Check runs, and disables (i.e. “bricks”) the app if debugging was detected in a previous run.
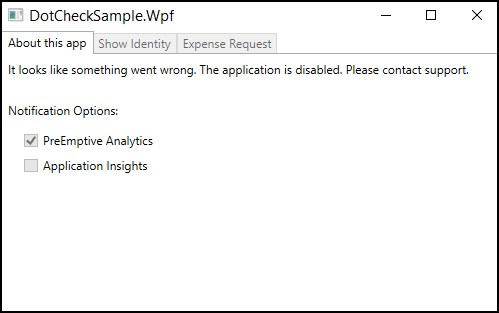
The details of the Shelf-Life Check are outside the scope of this article, but essentially the injected code determines if the application has expired, then sets an application defined field (_isExpired) appropriately. The developer has written code in the application that disables the UI based on the value of the _isExpired field.
An application that can “remember” that it has been attacked can change its behavior in subsequent runs, throwing new roadblocks in front of attackers. In this case, the entire application is disabled after debugging has been detected, and now the attacker must figure out why before proceeding.
When a user of the application changes tabs, the MainWindows.tabCtrl_SelectionChanged() event handler fires. That method in turn calls the MainWindows.InjectADebugCheckHere() method. The DebugCheckAttribute on this method is configured to call yet another method, MainWindow.DebugNotification(), if a debugger is detected. That method does three things:
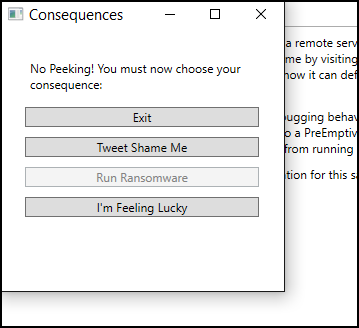
Consequences include:
Moving on to the “Expense Request” tab, the event handler for the Submit button, MainWindow.Submit_Click(), has a DebugCheckAttribute that is configured to hang the application one third of the time while submitting an expense request. Again, behavior that varies with each run frustrates and deters attackers and their tools. In addition to the Action, the DebugCheckAttribute is also configured to call the MainWindows.DisableSubmit() method. So if the application doesn’t hang during submitting, the “Submit” button is always subsequently disabled, preventing any further use of the feature in that session. Locking down sensitive features in response to debugging hinders attempts to exploit or corrupt those features.
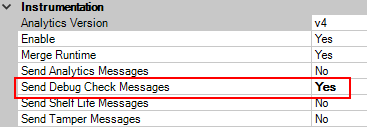
Last, Debug Check messages are always sent to a PreEmptive Analytics endpoint when debugging is detected. The application’s synthesized “License Key” is sent as part of the message. This is done entirely through code injection and Dotfuscator configuration:
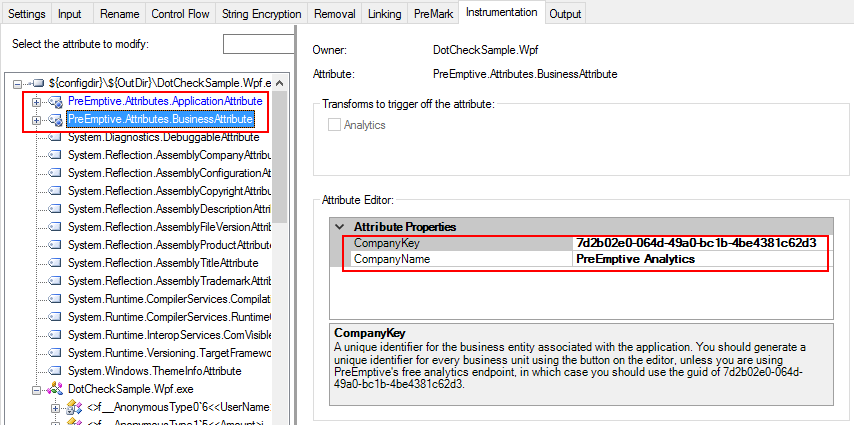
On the Instrumentation tab, there are Application and Business Attributes at the assembly level, with the BusinessAttribute using the Company Key for PreEmptive’s free Community Workbench.
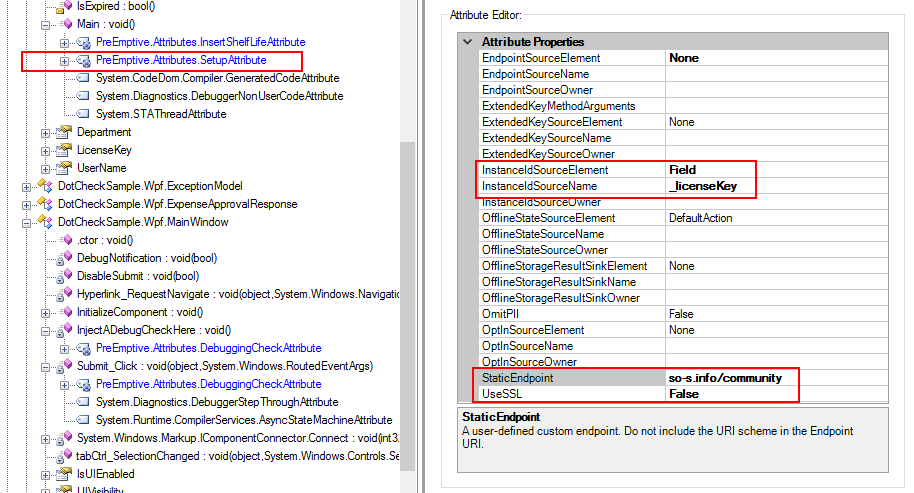
The App.Main method has a SetupAttribute, configured to use the endpoint for the Community Workbench. It also tells the injected code to retrieve the application’s license key from the _licenseKey field.
This is another example of alerting, providing notification and auditing of debugging attempts. In this case, the application’s debugging notifications are sent to the free Community Workbench [depreciated], and you can see a dashboard showing Debugging notifications here [depreciated].
Since the Professional Edition has more functionality than the Community Edition, the CE configuration is slightly different. To summarize the differences in functionality:
These limitations somewhat restrict what can be done in the CE configuration for the sample application, but the good news is that there is still a set of reasonably effective defenses:
After building the application and running it through Dotfuscator, you will want to verify that the injected defenses are working. You can test them using the Visual Studio debugger.
First, we will test the startup behavior when the application is launched by the debugger. One quick way to get the Visual Studio debugger to launch an external application, is via a C# project’s Debug properties: simply set the Start action as shown:
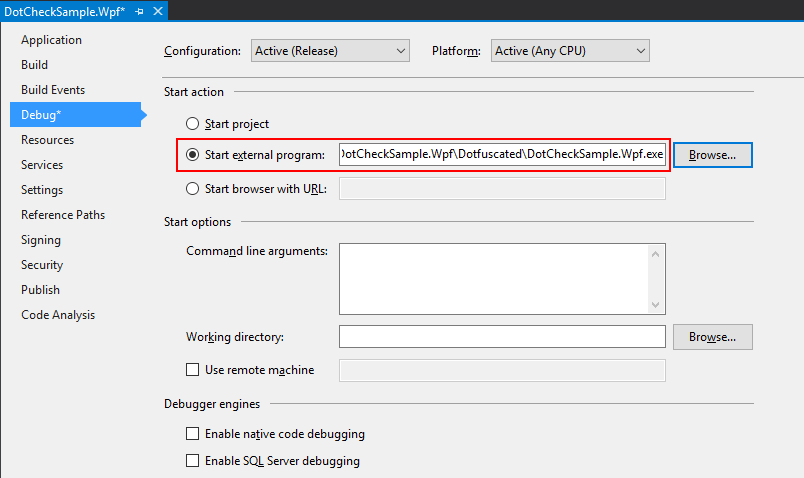
Once configured this way, pressing F5 or “Start Debugging” from the Debug menu will launch the protected version of the application under the VS Debugger. If the injected “Exit” action is working correctly, you won’t see much. The debugger will start, then stop again, and you will see a notice that the “program has exited” in the Debug Output window.
You can test the rest of the defenses by starting the application outside the debugger, then attaching the debugger to it via Visual Studio’s “Attach to Process” dialog. Try some of these tests with the debugger attached:
If your applications are worth protecting, and you consider unauthorized debugging a threat, you should be using Dotfuscator’s anti-debug defense capability. When you do, keep in mind some of the general principles we’ve highlighted in this article:
To learn more: